Probability (Mathematics) Class 9 - NCERT Questions
In a cricket match, a batswoman hits a boundary 6 times out of 30 balls she plays. Find the probability that she did not hit a boundary.
SOLUTION:Here, the total number of trials = 30
∴ Number of times, the ball touched boundary = 6
∴ Number of times, the ball missed the boundary
= 30 - 6 = 24
Let the event not hitting the boundary be represented by E, then
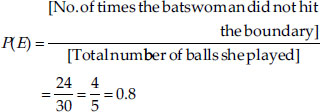
Thus, the required probability = 0.8
1500 families with 2 children were selected randomly, and the following data were recorded:
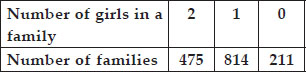
Compute the probability of a family, chosen at random, having
(i) 2 girls (ii) 1 girl (iii) No girl
Also check whether the sum of these probabilities is 1.
Total number of families = 1500.
(i) Number of families having 2 girls = 475
∴ Probability of a family having 2 girls

(ii) Number of families having 1 girl = 814
∴ Probability of a family having 1 girl

(iii) Number of families having no girl = 211
∴Probability of a family having no girl
∴
Now, the sum of the obtained probabilities
i.e. Sum of the above probabilities is 1
Refer to Example 5, Section 14.4, Chapter 14. Find the probability that a student of the class was born in August.
SOLUTION:From the graph, we have:
Total number of students born in various months = 40
Number of students born in August = 6
∴ Probability of a student of the IX-Class who was born in August

Three coins are tossed simultaneously 200 times with the following frequencies of different outcomes:
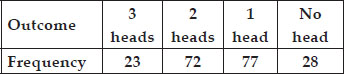
If the three coins are simultaneously tossed again, compute the probability of 2 heads coming up.
Total number of times the three coins are tossed = 200
Number of outcomes in which 2 heads coming up = 72
∴ Probability of 2 heads coming up

Thus, the required probability

An organisation selected 2400 families at random and surveyed them to determine a relationship between income level and the number of vehicles in a family. The information gathered
is listed in the table below.
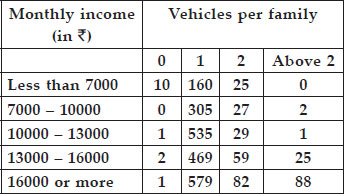
Suppose a family is chosen. Find the probability that the family chosen is
(i) earning ₹ 10000 - 13000 per month and owning exactly 2 vehicles.
(ii) earning ₹ 16000 or more per month and owning exactly 1 vehicle.
(iii) earning less than ₹ 7000 per month and does not own any vehicle.
(iv) earning ₹ 13000 - 16000 per month and owning more than 2 vehicles.
(v) owning not more than 1 vehicle.
Here, total number of families = 2400
(i) Number of families earning
₹ 10000 - ₹ 13000 per month and owning exactly 2 vehicles = 29
∴ Probability of a family earning
₹ 10000 -₹ 13000 and owning exactly
2 vehicles 29/2400.
(ii) Q Number of families earning ₹ 16000 or more and owning exactly 1 vehicle = 579
∴ Probability of a family earning ₹ 16000 or more and owning exactly 1
vehicle 
(iii) Q Number of families earning less than
₹ 7000 per month and do not own any vehicle = 10
∴ Probability of a family earning less than
₹ 7000 and owning no vehicle 
(iv) Q Number of families earning
₹ 13000 -₹ 16000 and owning more than 2 vehicles = 25
∴ Probability of a family earning ₹ 13000- ₹ 16000 and owning more than
2 vehicles 
(v)Q Number of families owning not more than 1 vehicle
= [Number of families having no vehicle] + [Number of families having only 1 vehicle]
∴ = [10 + 1 + 2 + 1] + [160 + 305 + 535 + 469 + 579]
= 14 + 2048 = 2062
∴ Probability of a family (owning not more than one vehicle)
Refer to Table 14.7, Chapter 14.
(i) Find the probability that a student obtained less than 20% in the mathematics test.
(ii) Find the probability that a student obtained marks 60 or above.
From the table 14.7, we have:
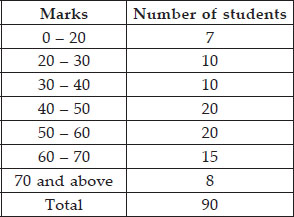
Total number of students = 90
(i) From the given table, number of students who have obtained less than 20% marks = 7
∴ Probability of a student (obtaining less than 20% marks)

(ii) From the given table, number of students who obtained marks 60% or above = [Number of students in class-interval 60 - 70] +
[Number of students in the class interval 70 and above]
= 15 + 8 = 23
∴ Probability of a student who obtain 60 marks and above

To know the opinion of the students about the subject statistics, a survey of 200 students was conducted. The data is recorded in the following table.
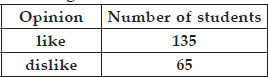
Find the probability that a student chosen at random
Total number of students whose opinion is obtained = 200
(i) Number of students (who like statistics)
= 135
Probability of students who like statistics

(ii) Number of students who do not like statistics = 65
∴ Probability of students (who dislike statistics)

Refer to Q.2, Exercise 14.2. What is the empirical probability that an engineer lives:
(i) less than 7 km from her place of work.
(ii) more than or equal to 7 km from her place of work.
(iii) within  km from her place of work.
Total number of engineers = 40
(i) Number of engineers who are living within 7 km from their work place = 9
∴ Probability of an engineer (living within 7 km from work place)

(ii) Number of engineers living at a distance more than or equal to 7 km from their work place = 31
∴ Probability of an engineer (living at distances more than or equal to 7 km)

(iii) The number of engineers living within
km from work place = 0
∴ Probability of an engineer who is living within
km from work place

Activity: Note the frequency of two-wheelers, three-wheelers and four-wheelers going past during a time interval, in front of your school gate. Find the probability that any one vehicle out of the
total vehicles you have observed is a two-wheeler.
It is an activity. Students can do it themselves.
Q 10.Activity: Ask all the students in your class to write a 3-digit number. Choose any student from the room at random. What is the probability that the number written by her/him is divisible by 3∴ Remember that a number is divisible by 3,
if the sum of its digits is divisible by 3.
A class room activity for students.
Q 11.Eleven bags of wheat flour, each marked 5 kg, actually contained the following weights of flour (in kg).
4.97 5.05 5.08 5.03 5.00 5.06 5.08 4.98 5.04 5.07 5.00
Find the probability that any of these bags chosen at random contains more than 5 kg of flour.
Total number of bags = 11
Number of bags having more than 5 kg of flour = 7
∴ Probability of a bag (having more than
5 kg of flour) 
In Q.5, Exercise 14.2, you were asked to prepare a frequency distribution table, regarding the concentration of sulphur dioxide in the air in parts per million of a certain city for 30 days.
Using this table, find the probability of the concentration of sulphur dioxide in the interval 0.12-0.16 on any of these days.
The number of days (on which the sulphur dioxide concentration is in the interval
0.12 - 0.16) = 2
∴ Probability of a day (on which sulphur dioxide is in interval (0.12 - 0.16))

In Q.1, Exercise 14.2, you were asked to prepare a frequency distribution table regarding the blood groups of 30 students of a class. Use this table to determine the probability that a student of
this class, selected at random, has blood group AB.
Total number of students = 30
Number of students having blood group as AB = 3
∴ Probability of a student (whose blood group is AB)
 .
.